Table of Contents
ToggleWhat is NetSuite Reporting and Analytics?

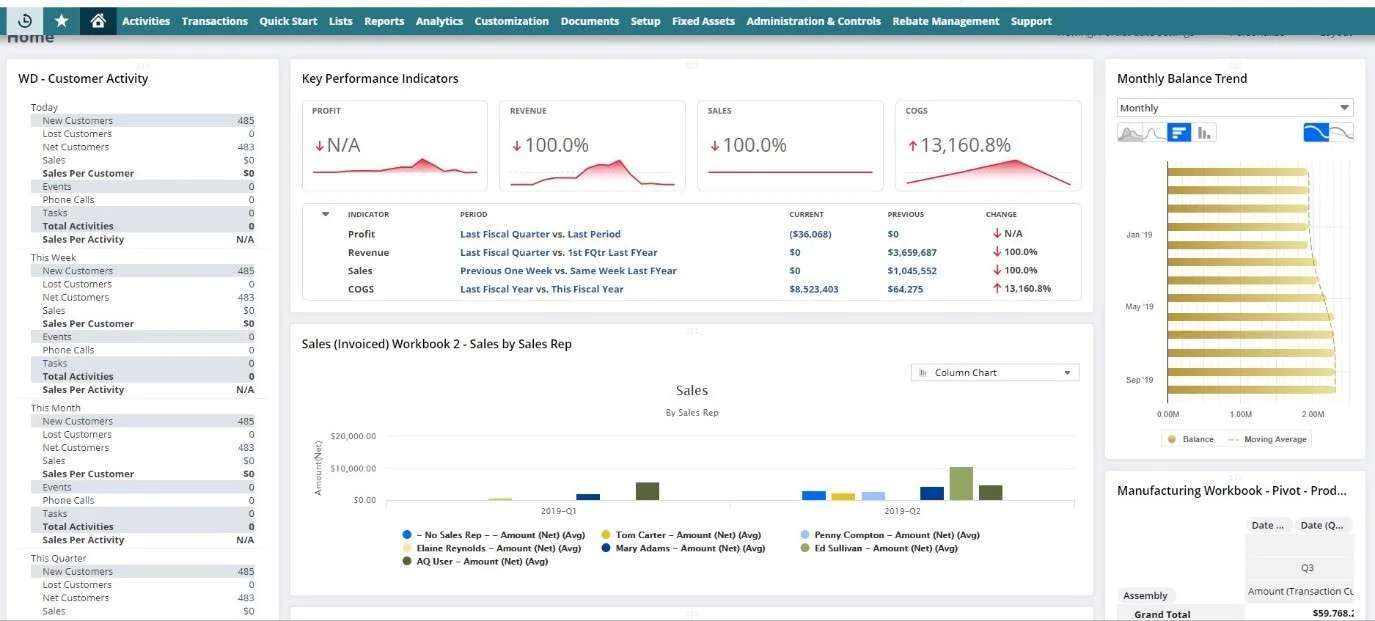
- Customizable Layout: NetSuite allows users to customize dashboard layouts according to their specific requirements. You can arrange widgets, charts, graphs, and other elements to create a personalized view that aligns with your business needs. Whether you’re focusing on financial metrics, sales performance, inventory levels, or customer data, you can tailor the dashboard layout to prioritize the most relevant information.
- Role-based Dashboards: NetSuite’s role-based dashboard functionality ensures that users have access to pertinent information based on their roles and responsibilities within the organization. For example, a sales manager might have a dashboard that highlights sales performance metrics, pipeline opportunities, and customer engagement data, while a finance manager’s dashboard might focus on financial statements, budgetary information, and cash flow analysis.
- Real-time Data Refresh: One of the key features of NetSuite’s real-time dashboards is the ability to display up-to-date information. As transactions are processed and data is updated within the system, the dashboard widgets and metrics automatically refresh to reflect the latest data, ensuring that users have access to real-time insights and analytics.
- Interactive Visualizations: NetSuite’s dashboards feature interactive visualizations such as charts, graphs, and gauges that facilitate data interpretation and analysis. Users can drill down into specific data points, apply filters, and explore underlying data to gain deeper insights into business performance trends, patterns, and anomalies.
- Key Performance Indicators (KPIs): NetSuite allows users to define and track key performance indicators (KPIs) relevant to their business objectives. These KPIs are prominently displayed on the dashboard, providing users with a quick overview of critical metrics such as sales revenue, profitability margins, inventory turnover, customer retention rates, and more.
- Alerts and Notifications: NetSuite’s real-time dashboards can be configured to generate alerts and notifications based on predefined thresholds or criteria. For example, if inventory levels fall below a certain threshold, or if sales performance deviates from the forecasted targets, users can receive automated alerts via email or within the dashboard interface, enabling timely intervention and corrective action.
- Drill-down Capabilities: Users can drill down from summary-level dashboard widgets to access detailed transactional data and reports. This drill-down functionality facilitates deeper analysis and exploration of underlying data, allowing users to identify root causes, trends, and opportunities for improvement.
- Mobile Accessibility: NetSuite’s real-time dashboards are accessible via mobile devices, providing users with anytime, anywhere access to critical business information. The mobile-friendly interface is optimized for smartphones and tablets, ensuring a seamless user experience on the go.
- Integration with Other Modules: NetSuite’s ERP real-time dashboards seamlessly integrate with other modules such as finance, sales, inventory management, purchasing, and CRM (Customer Relationship Management). This integrated approach allows users to consolidate data from multiple sources and present a unified view of business performance across various departments and functions.
KPI Reporting and Analytics in NetSuite:
NetSuite’s KPI reporting empowers businesses with real-time insights into key performance indicators, driving informed decision-making. Users can define and track critical metrics aligned with business goals, from sales revenue to inventory turnover. The customizable dashboards offer interactive visualizations, role-based views, and mobile accessibility for on-the-go monitoring. With drill-down capabilities and alerts, NetSuite ensures a comprehensive understanding of performance trends and timely responses to deviations. The seamless integration with other modules enhances data consolidation, presenting a unified view of business performance. NetSuite’s KPI reporting is a vital tool for achieving operational excellence and strategic success.
In summary, NetSuite Reporting and Analytics are a powerful tool for monitoring, analyzing, and optimizing business performance. By providing users with immediate visibility into key metrics, trends, and insights, these dashboards empower organizations to make informed decisions, drive operational excellence, and achieve strategic objectives.


