NetSuite is much more than just an enterprise resource planning tool; it is an analytics powerhouse that gives businesses real-time data and insights. The ability to customize dashboards in NetSuite unlocks this potential, allowing businesses to make informed, data-driven decisions. This guide will show you how to customize your NetSuite dashboards for maximum analytical advantage.
Table of Contents
ToggleThe Power of a Custom Dashboard
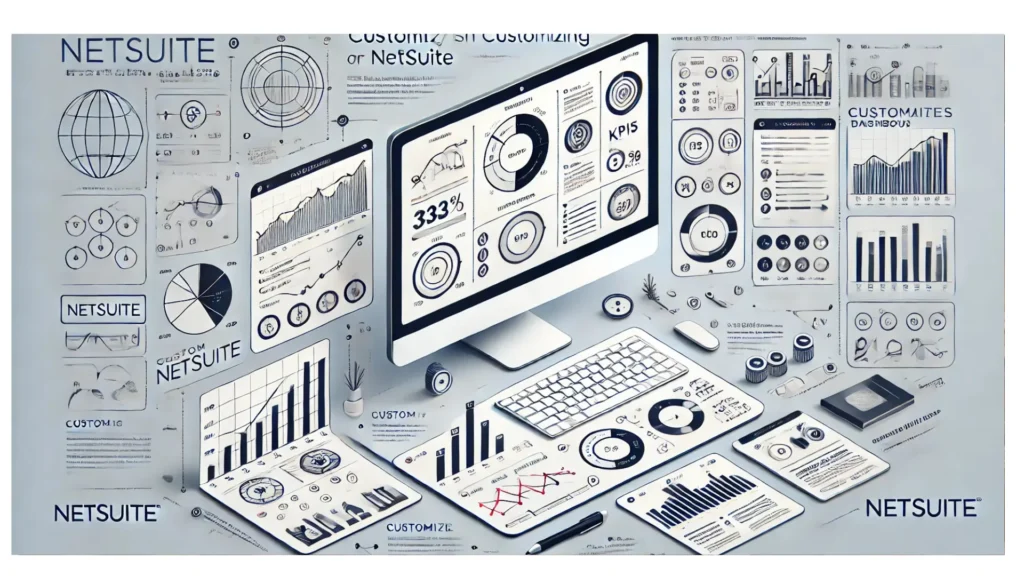
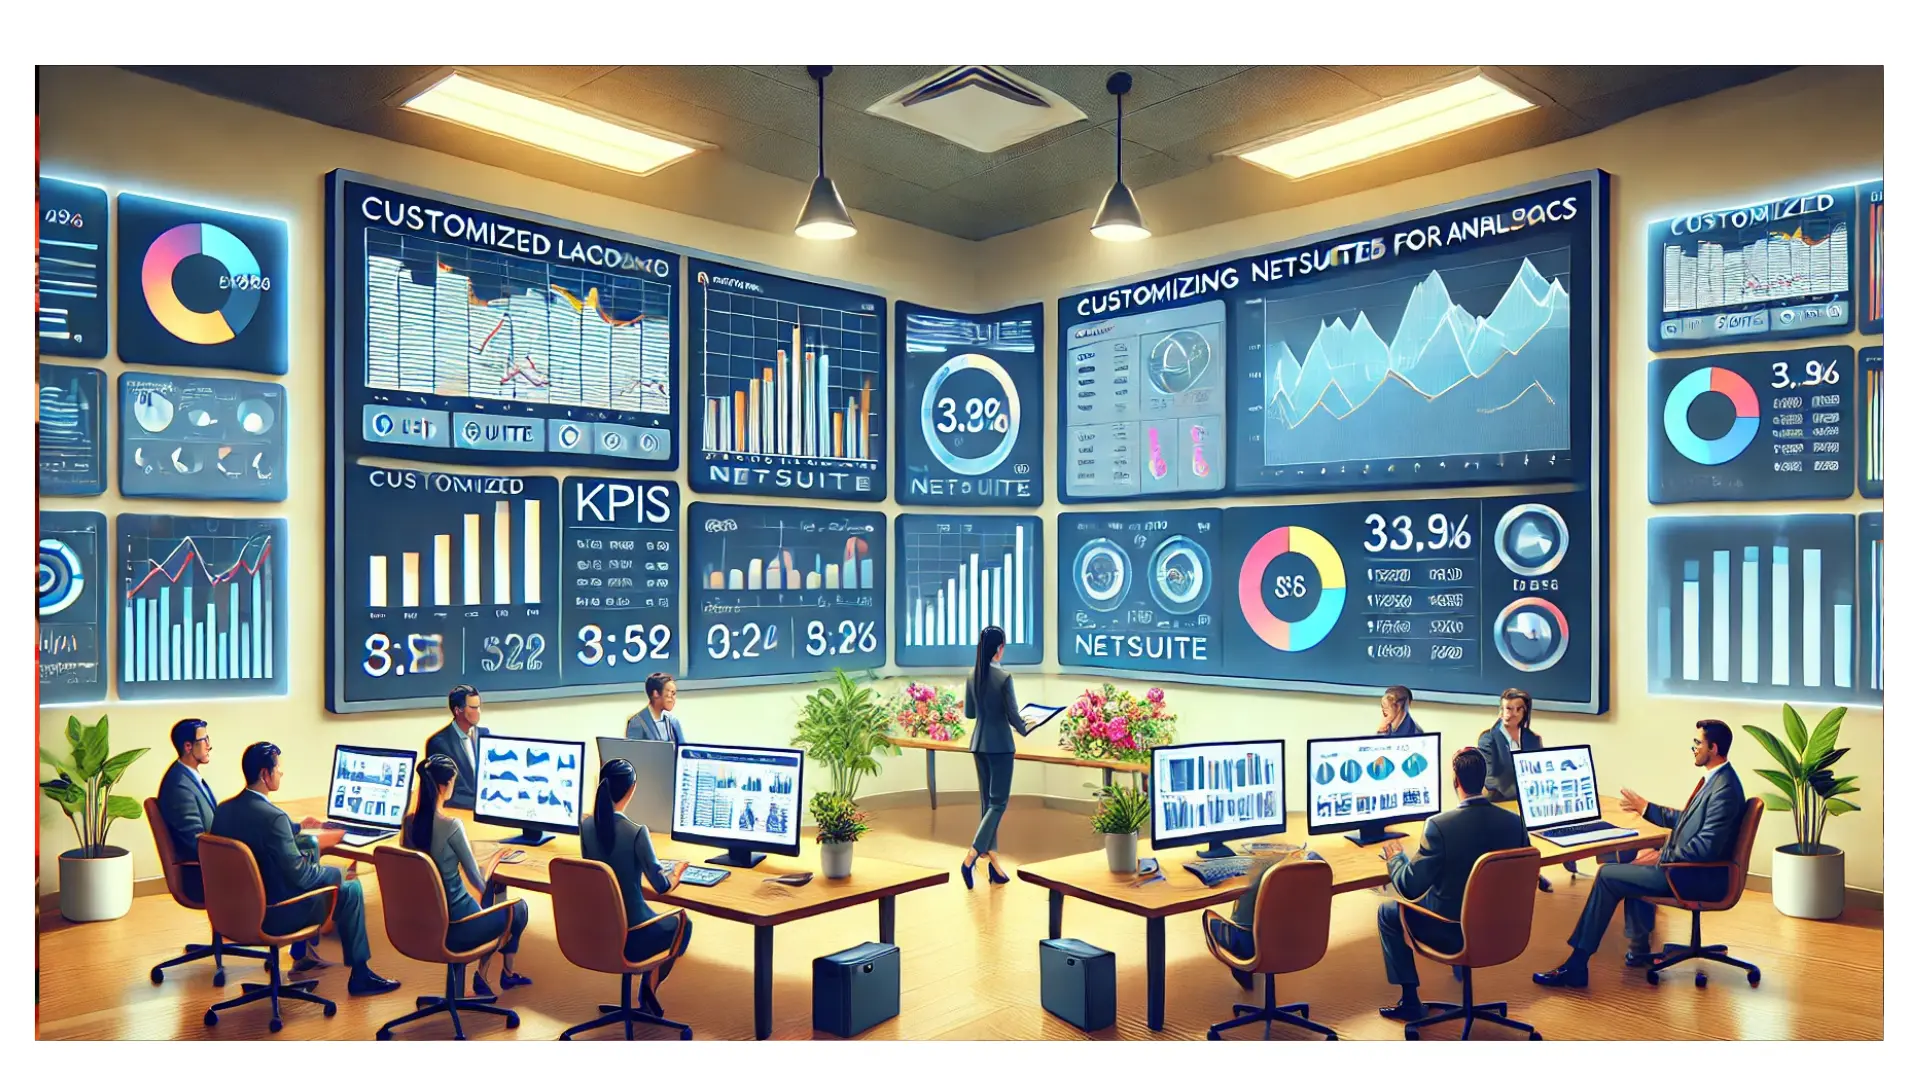
NetSuite dashboards are interactive panels that provide an integrated view of your organization’s most important metrics, KPIs, and real-time data. With customisation, businesses can bring focus to the most important information presented in a dashboard, thus increasing access and usability. Well-configured dashboards will save time by collating vital information, enabling all levels of employees to concentrate on what is most important.
NetSuite Analytics Capabilities
The analytics in NetSuite are built into the system such that users can create reports as well as dashboards relevant to their needs. Such a platform offers powerful reporting tools including real-time data analysis, predictive analytics, and customizable metrics in support of deeper business insights with regard to operations, financials, and customer behavior.
Dashboards to Customize
To really use NetSuite dashboards capability to its fullest, one must understand what can be customized and how each can contribute to more actionable insights.
- Portlets for Specific Data Needs: Portlets form the actual building block of a dashboard in the system NetSuite. Portlets can showcase diverse kinds of data, charts, reminders, KPIs, and report type stuff. As users configure these portlets in a meaningful manner to suit specific roles. Therefore, a sales manager could possibly put priority on his or her sales managers’ daily report of the customers contacted and, conversely, expense report and other financial data from an analyst’s standpoint.
Navigate to your dashboard, click on “Personalize,” then select the portlet type you want. Drag and drop into the desired location on the dashboard. Customize by selecting data sources, setting filters, and adjusting visual formats.
- Calibration of KPIs for Clarity and Relevance: Essential performance indicators on a dashboard are meant to measure success in real-time, and by customizing what KPIs are presented and how, users create a more defined picture of their goals and accomplishments. Users in NetSuite can set KPIs tailored to their specific business goals and objectives, from financial targets to sales quotas.
Go to the KPI portlet and click “Edit.” Define the metric you want to have by selecting the data source, such as sales orders or levels of inventory. Apply filters so you could zero in on specific subsets of data and set color codes for performance status, say, red for underperforming and green for on-target.
- Custom Reports for Deeper Insights: NetSuite’s built-in reporting tools are powerful, but customizing them can make your data analysis even more impactful. Creating custom reports tailored to your business needs allows for detailed exploration of trends, patterns, and anomalies. Custom reports can be integrated into your dashboard to provide quick access without having to navigate away from your main screen.
Use NetSuite’s “Report Builder” tool to create reports. Choose your desired data type, set filters for specific criteria, and customize the layout. Save and add these reports to your dashboard through the “Reports” portlet.
- Incorporating Graphs and Charts for Visual Clarity: While raw data may be daunting, the visual will make complex information very simple. Grap and charting can add excellent value to the dashboard by showing trends over time, comparison, and progress toward goals.
How to personalize charts Choose “Chart” as the portlet type and then select the data source that you wish to view in graphical representation. NetSuite supports quite a number of charting types, including bar, line, pie, and area. Personalize your display: alter axis labels, color, and legend for better readability.

Advanced Customization Tips for Enhanced Analytics
While basic customization is really powerful, it’s often the advanced features of NetSuite that can really make a dashboard pop.
- Role-Based Dashboards: NetSuite allows for various views of the dashboard for different user roles. This is helpful in ensuring that users see the information most relevant to their tasks and responsibilities to enhance productivity and efficiency.
Implement Role-Specific Dashboards Within the “Dashboard” setup section, create multiple views by role. For example, the finance team may require dashboards with a financial report and cash flow focus, and the HR team could focus on employee metrics and training progress.
- Integrate Other External Data Sources: For all those businesses using different software solutions, this external data can be integrated and will provide an all-round view. NetSuite’s SuiteAnalytics Connect offers the possibility of importing external data that can then be merged with NetSuite’s internal data for the comprehensive dashboard.
Utilize SuiteAnalytics Connect with ODBC or JDBC drivers to access and import data from other systems. Once imported, create a combined report or portlet that provides insights from both sources.
- Automating Reports for Timely Updates: Automation is crucial for staying current with dynamic data. NetSuite enables users to schedule and automate the running of reports, ensuring that your dashboard always displays the most up-to-date information.
Go to “Reports,” select your custom report, and click “Schedule.” Enter the frequency: daily, weekly, or monthly, and select the recipients. NetSuite will automatically run and email the report.

Best Practices for Customizing Your Dashboard
To reap the most benefits from your customized dashboards, remember the following best practices:
- Keep It Simple: Avoid cluttering the dashboard with too much information. Instead, focus on the most important data that provides value.
- Periodic Revision: The layout of dashboards should be revisited periodically to accommodate the shifting business needs and KPIs.
- User Training: Instruct employees on how to engage with and personalize dashboards as required.
- Security Controls: Implement role-based access controls to prevent unauthorized users from accessing or altering dashboard data.
Conclusion
With a focus on analytics, you can customize your NetSuite dashboards in ways that transform the way your business accesses and interprets data. Strategically setting up portlets, KPIs, reports, and visual representations enables you to build a powerful tool for enhancing productivity and better decision-making. Whether you require role-tailored dashboards, the integration of external data, or automated report scheduling, NetSuite’s extensive capabilities ensure that your dashboards will always be a source of invaluable insight.
These tools and best practices will take your business to a whole new level of maximizing the power of NetSuite’s analytics to make an informed strategy for growth.


