Table of Contents
ToggleComprehensive Guide on NetSuite Custom KPIs & KPI Portlet
Users can customize their dashboards with NetSuite using Custom KPIs, which give them performance-driven, role-based, and targeted metrics.
A number of standard KPIs are already available by default in NetSuite, including Bank Balance, COGS, Credit Card Balance, Deferred Revenue, Equity, Expenses, Forecast, Income, Inventory, Net Cash Flow, and Profit, to mention a few.
How KPI Portlet works?
You can view your data in the best possible amount of space by placing the KPI portlet at the top of the widest column on your home dashboard. As an alternative, KPIs can be added to any other column. Click “Setup” on the KPI portlet to accomplish this. Usually, for a user, NetSuite will already have made some recommendations for KPIs. Go to “Add Standard KPIs” to add or remove these KPIs. You can also rearrange the KPIs that are displayed to suit your preferences. You can set both a data range and a comparison range for comparison. Make sure the two date ranges for example, month-to-month or year-over-year complement one another.
How can KPI Portlet help you?
KPIs are crucial instruments for management. They direct behaviour, productivity, and decision-making while offering clarity and focus. KPIs provide accountability and transparency as well. A company’s mission and values are communicated throughout the organization by the KPIs it uses, and this communication also establishes the culture of the workplace.
As a result, choosing KPIs that are acceptable and in line with the objectives of the business is crucial. KPIs are significantly more effective when used to examine development over longer time periods, even though they might offer a helpful snapshot at a particular moment in time. When organizations combine these with other significant KPIs in a dashboard, they become even more valuable and provide a more comprehensive picture of a company’s fundamental operations.
What are types of KPI Indicators
Despite the large number of KPIs available, the majority can be broadly classified according to their intended use. The “balanced scorecard” framework of views is one popular technique for classifying KPIs, and it consists of the following:
- Customer perspective or outcome focus: KPIs that center on customer interactions and their opinions on the performance and quality of the product are known as outcome- or customer-focused KPIs. These could include average handle time in a call center, brand awareness indices, customer happiness, acquisition, and retention.
- Financial perspective: KPIs that look at risk, profitability, liquidity, and financial efficiency from a financial standpoint. Days Sales Outstanding (DSO) and Current Ratio are two examples.
- Growth perspective: Key Performance Indicators (KPIs) that track returns on people, equipment, and research investments made to attain the targeted medium- and long-term growth. Examples include return on marketing spend and cost of acquisition for new customers.
- Process perspective: KPIs that highlight a particular process’s level of efficiency. These could be billable hours in a professional services firm or units produced per hour in a manufacturing facility. HRM KPIs are frequently measured in a wide range of sectors. They usually gauge how productive and efficient a worker is. Closed sales per salesperson and the cost of processing accounts payable per invoice are two examples. Apart from turnover and recruiting time, other HRM KPIs track absenteeism.
- Project-specific: These usually track advancement toward important deliverables, deadlines, or milestones.
Adding Custom KPI Portlet
Follow these steps to add your own KPIs to a KPI portlet:
- Toggle the down arrow on the KPI portlet’s upper right corner, then select “Set Up.”
- To access the ” Choose Custom Key Performance Indicators” window, click Add Custom KPIs.
- A saved search can be moved to the right list by clicking on it in the left list. A maximum of ten custom KPIs are available.
- Click Done after you’re done. “c” icons are used to indicate selected custom KPIs.
- Choose the date ranges that you want to use for every KPI.
- You can choose to have each KPI indicate if an indication is higher or lower than a given threshold. You can be informed if something is off by doing this.
- Select the date range from the “compare range” option if you wish to compare the results.
- Select Save.
Since groups are not accounted for in KPI calculations, summary search filters cannot be enforced by KPIs. The results for a custom KPI may not match the search results when it is run if the stored search that is used has any summary search criteria.
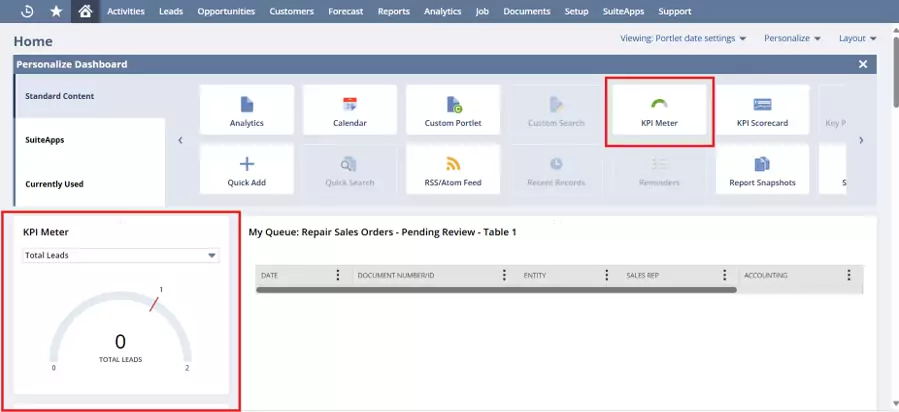
KPI Meter
Key performance indicators (KPIs) can be efficiently tracked and monitored for your company with the use of KPI meters. You may make straightforward, understandable graphical representations of your KPIs with KPI meters. Each dashboard has the capacity to show up to three KPI meters, giving you a rapid overview of the most significant indicators.
Additionally, KPI meters make it simple to change the data window on your reports and KPIs. To change the time period for which your data is presented, just use the Portal Date Selector that is located next to Personalize on the dashboard. This keeps you updated about important information and enables you to act swiftly and effectively when making judgments.